
Page 81 - RFU Annual Report 2018
P. 81
7
FINANCIAL STATEMENTS
9
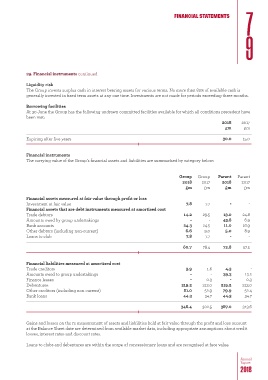
29. Financial instruments continued
Liquidity risk
The Group invests surplus cash in interest bearing assets for various terms. No more than 80% of available cash is
generally invested in fixed term assets at any one time. Investments are not made for periods exceeding three months.
Borrowing facilities
At 30 June the Group has the following undrawn committed facilities available for which all conditions precedent have
been
met:
2018 2017
£m £m
Expiring after five years 30.0 15.0
Financial instruments
The carrying value of the Group’s financial assets and liabilities are summarised by category below:
Group Group Parent Parent
2018 2017 2018 2017
£m £m £m £m
Financial assets measured at fair value through profit or loss
Investment at fair value 7.8 7.7 - -
Financial assets that are debt instruments measured at amortised cost
Trade debtors 14.2 29.5 13.0 24.8
Amounts owed by group undertakings - - 43.8 6.9
Bank accounts 24.3 24.5 11.0 16.9
Other debtors (including non-current) 6.6 9.0 5.0 8.9
Loans to club 7.8 7.7 - -
60.7 78.4 72.8 57.5
Financial liabilities measured at amortised cost
Trade creditors 3.9 1.6 4.3 -
Amounts owed to group undertakings - - 39.3 13.2
Finance leases - 0.3 - 0.3
Debentures 219.2 213.0 219.2 213.0
Other creditors (including non-current) 81.0 52.9 79.9 52.4
Bank loans 44.3 34.7 44.3 34.7
348.4 302.5 387.0 313.6
Gains and losses on the re-measurement of assets and liabilities held at fair value through the profit and loss account
at the Balance Sheet date are determined from available market data, including appropriate assumptions about credit
losses, interest rates and discount rates.
Loans to clubs and debentures are within the scope of concessionary loans and are recognised at face value.
Annual
Report
2018