
Page 84 - RFU Annual Report 2018
P. 84
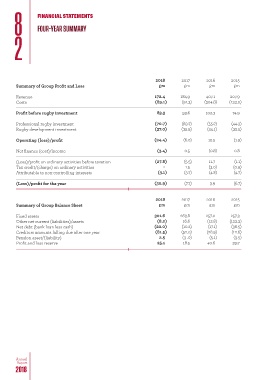
8          FINANCIAL STATEMENTS


                  FOUR-YEAR SUMMARY
       2


                                                                      2018        2017       2016       2015
        Summary of Group Profit and Loss                                £m         £m         £m         £m

        Revenue                                                       172.4      184.9       407.1     207.9
        Costs                                                         (89.1)      (91.3)    (304.8)    (133.0)
        Profit before rugby investment                                 83.3       93.6      102.3       74.9


        Professional rugby investment                                 (70.7)      (63.7)     (55.7)     (44.3)
        Rugby development investment                                  (37.0)      (35.9)     (34.1)     (32.5)

        Operating (loss)/profit                                       (24.4)       (6.0)      12.5       (1.9)

        Net finance (cost)/income                                      (3.4)       0.5        (0.8)      0.8

        (Loss)/profit on ordinary activities before taxation          (27.8)       (5.5)      11.7       (1.1)
        Tax credit/(charge) on ordinary activities                        -        1.5        (3.0)      (0.9)
        Attributable to non-controlling interests                      (3.1)       (3.7)      (4.8)      (4.7)

        (Loss)/profit for the year                                    (30.9)       (7.7)      3.9        (6.7)


                                                                      2018        2017       2016       2015
        Summary of Group Balance Sheet                                  £m         £m         £m         £m

        Fixed assets                                                  301.6      263.8      257.0       257.3
        Other net current (liabilities)/assets                         (8.2)      16.6       (12.8)    (123.3)
        Net debt (bank loan less cash)                                (20.0)      (10.2)     (17.1)     (36.5)
        Creditors amounts falling due after one year                  (81.5)      (52.0)     (28.9)     (12.6)
        Pension asset/(liability)                                       2.5       (3 .0)      (5.1)      (3.5)
        Profit and loss reserve                                        25.1       18.5       40.6       29.7


        Annual
         Report
        2018