
Page 71 - RFU Annual Report 2018
P. 71
6
FINANCIAL STATEMENTS
9
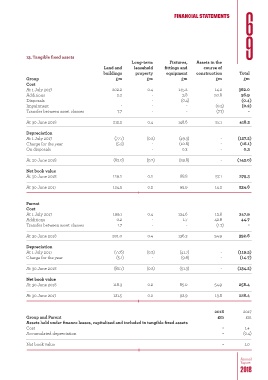
13. Tangible fixed assets
Long-term Fixtures, Assets in the
Land and leasehold fittings and course of
buildings property equipment construction Total
Group £m £m £m £m £m
Cost
At 1 July 2017 202.2 0.4 145.2 14.2 362.0
Additions 2.3 - 3.8 50.8 56.9
Disposals - - (0.4) - (0.4)
Impairment - - - (0.2) (0.2)
Transfer between asset classes 7.7 - - (7.7) -
At 30 June 2018 212.2 0.4 148.6 57.1 418.3
Depreciation
At 1 July 2017 (77.7) (0.2) (49.3) - (127.2)
Charge for the year (5.3) - (10.8) - (16.1)
On disposals - - 0.3 - 0.3
At 30 June 2018 (83.0) (0.2) (59.8) - (143.0)
Net book value
At 30 June 2018 129.2 0.2 88.8 57.1 275.3
At 30 June 2017 124.5 0.2 95.9 14.2 234.8
Parent
Cost
At 1 July 2017 199.1 0.4 134.6 13.8 347.9
Additions 0.2 - 1.7 42.8 44.7
Transfer between asset classes 1.7 - - (1.7) -
At 30 June 2018 201.0 0.4 136.3 54.9 392.6
Depreciation
At 1 July 2017 (77.6) (0.2) (41.7) - (119.5)
Charge for the year (5.1) - (9.6) - (14.7)
At 30 June 2018 (82.7) (0.2) (51.3) - (134.2)
Net book value
At 30 June 2018 118.3 0.2 85.0 54.9 258.4
At 30 June 2017 121.5 0.2 92.9 13.8 228.4
2018 2017
Group and Parent £m £m
Assets held under finance leases, capitalised and included in tangible fixed assets
Cost - 1.4
Accumulated depreciation - (0.4)
Net book value - 1.0
Annual
Report
2018